@iamartharrisonpublicprivate
Art Harrison — full public analyticsArt Harrison — your private dashboard
Now
Channel state
Fresh upload
A fresh upload is out; its first views are still coming in.
Changed fromOne-video carry
- Recent uploads, last 14d
- 2
- First-week candidate vs baseline
- 0 vs median 1
A steady week — nothing unusual moved.
0
the channel's views over the last 7 days.
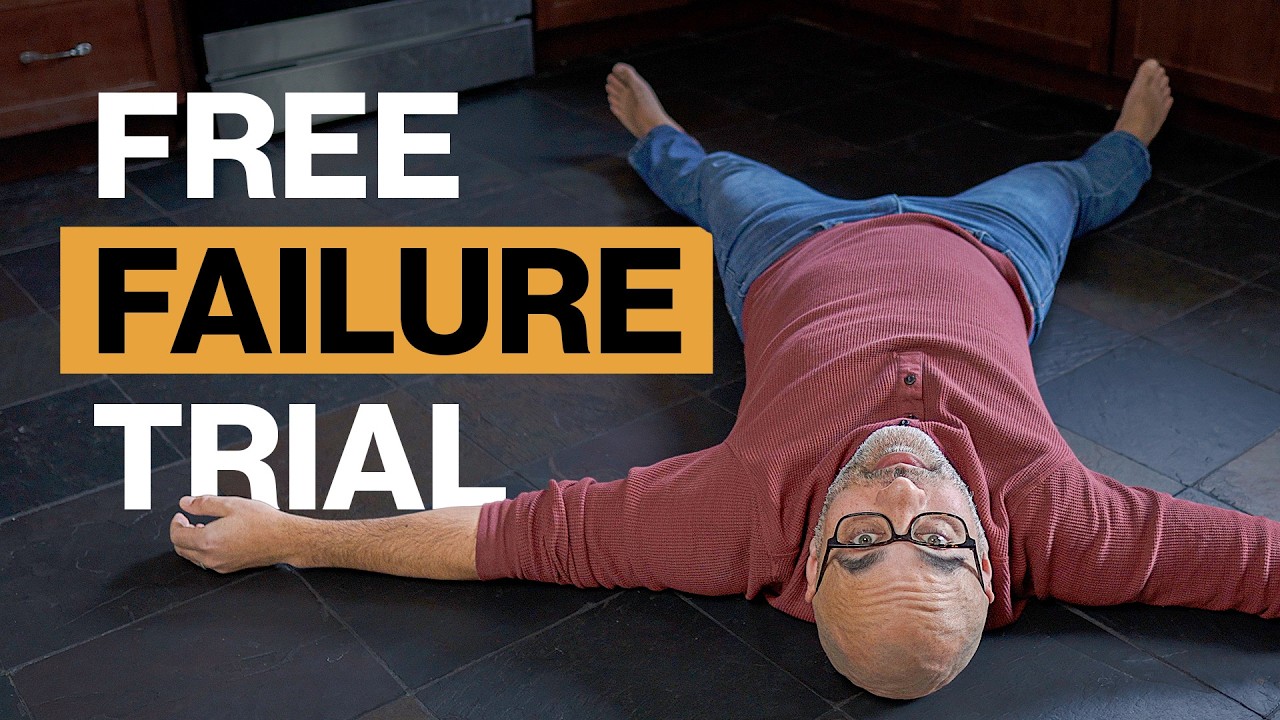
Why You Can Fail and They Can't most recent upload0 views
What if You Just Said F**K It and Tried? earlier upload1 views
First light
Art Harrison's opening 2 days — 2 views so far.
Reach
views, last 28 days: pool median 220; pool middle half 150 to 240.
first-week views per video: pool median 7; pool middle half 4.5 to 8.8.
views by day 7 per video: pool median 7; pool middle half 2 to 24.
Growth
net subscribers, last 28 days: pool median 1.1; pool middle half 0 to 3.2.
uploads, last 28 days: pool median 2.2; pool middle half 0 to 5.4.
Impressions & CTR
CTR, last 28 days: pool median 2.4%; pool middle half 2.0% to 5.4%.
Traffic mix, share of views
Browse: pool median 20.0%; pool middle half 12.4% to 28.2%.
Suggested: pool median 52.9%; pool middle half 51.8% to 70.9%.
Search: pool median 4.1%; pool middle half 2.1% to 4.5%.
External: pool median 0.4%; pool middle half 0.2% to 0.5%.
Retention
audience still watching at halfway: pool median 23.9%; pool middle half 13.8% to 25.2%.
open the workingshide the workings
Newest video

Why I Told 2,500 People I Was Failing
New upload — fuller data appears in about 2 days.
Next
Day-to-day, it tracks toward roughly 0.5 to 1.5 views a day by September 6.
Subscribers: 0 on Aug 22, 2026 → 0 on Aug 23, 2026.
The trajectory chart draws with the page's scripts.
where this pace comes fromhide the workings
At the pool's typical pace, the channel crosses 5 subscribers around December 26.
No clear shift in this channel's phase in the next month.

Show the embed codeHide the embed code
<a href="https://openchannelstats.com/@iamartharrison"><img src="https://openchannelstats.com/@iamartharrison/badge.svg" alt="Art Harrison on Open Channel Stats" width="320" height="72"></a>